Āyuṣyaby AnahataSri · ASA = AnahataSri Ayushya PV
Shubh Deepavali

Happy Diwali. Welcome to Āyuṣya.

Diwali, the festival of lights, falls on Sunday 8 November 2026 this year. From all of us at AnahataSri, thank you for visiting. Light that lasts is a good way to think about solar modules too: the question is not only how much power a module makes on day one, but how long it keeps making it.

Date: Government of India central holiday list 2026 (Controller General of Communication Accounts).

Āyuṣya (आयुष्य, “long life”) follows degradation from the cell, through the bill of materials and the module, to the power plant, and turns it into a scorecard and a report that a developer, an investor or a banker can read.

Scroll: four short stories ↓

Story 1 of 4

How PV reliability grew up

Reliability testing for solar modules has a public history that starts in laboratories and space programmes and runs through today's international standards. Each date below links to its source.

  1. 1883

    Selenium cells

    Charles Fritts coats selenium with an ultrathin, nearly transparent layer of gold; the cells are less than one percent efficient.

    Sources: Britannica, Charles Fritts; APS News.

  2. 1954

    The first practical silicon cell

    On 25 April 1954 Bell Labs (Chapin, Fuller and Pearson) announces the silicon solar cell, about 6% efficient. Some timelines, such as the US DOE’s, give 4% for the first cell, so we say “about 6%”.

    Sources: APS News, American Physical Society; US DOE, The History of Solar.

  3. 1958

    Solar power in orbit

    Vanguard 1, the first solar-powered satellite, is launched on 17 March 1958.

    Source: NASA, Vanguard Satellite, 1958.

  4. 1975 to 1986

    JPL’s Flat-Plate Solar Array Project

    The Flat-Plate Solar Array Project, managed by NASA’s Jet Propulsion Laboratory for the US Department of Energy, develops terrestrial module technology and reliability testing. Its goals for 1985 were modules with 10% efficiency, a 20-year lifetime and a price of $0.50 per watt (1975 dollars).

    Source: JPL/NASA NTRS, JPL Publication 86-31.

  5. 1975 to 1985

    Block buys and qualification tests

    JPL buys modules in five blocks (I to V) and requires each to pass a set of tests such as thermal cycling, humidity, mechanical load and hail. An NREL paper, citing Whipple, reports that modules tested to Block V (specified in 1981) had failure rates under 0.1%, against 45% for earlier modules.

    Sources: NREL, Photovoltaic-Reliability R&D Toward a Solar-Powered World (NREL/CP-520-44886); NREL, DuraMAT consortium paper.

  6. 1993

    The first IEC module qualification standard

    The block-buy test protocols, carried forward with others, become IEC 61215, first published on 30 April 1993.

    Sources: NREL, DuraMAT consortium paper; IEC Webstore, IEC 61215:1993.

  7. 2013

    Measuring degradation in the field

    Jordan and Kurtz review nearly 2,000 field degradation rates from 40 years of literature and find a median of 0.5% per year.

    Source: Jordan and Kurtz, Photovoltaic Degradation Rates: An Analytical Review (NREL).

  8. 2021

    Today’s standards

    IEC 61215-1:2021 (edition 2.0) sets the design qualification and type approval requirements; IEC states that its test results are not a quantitative prediction of module lifetime. IEC TS 63209-1:2021 adds extended-stress test sequences to compare the longer-term reliability of modules and bills of materials.

    Sources: IEC Webstore, IEC 61215-1:2021; IEC Webstore, IEC TS 63209-1:2021.
Story 2 of 4

Why reliability matters

“The degradation rate expressed in percentual power loss per year is needed to determine the payback time and lifetime energy production of a PV project.”

IEA-PVPS Task 13, report T13-32:2025, executive summary.

“Accurate predictions of return on investment require accurate prediction of decreased power output over time.”

Jordan and Kurtz (2013), NREL.

Passing a qualification test is a minimum, not a lifetime. That gap, between “passed the test” and “how much power will this build of module make in year 25 in this climate”, is what Āyuṣya is built to make visible.

Story 3 of 4

The need of the hour

India

171.05 GW

Cumulative installed solar capacity in India, as of 30 September 2026.

MNRE, Physical Achievements.

500 GW

India’s non-fossil capacity target for 2030; 300.50 GW had been reached by 31 July 2026.

PIB, India achieves 300 GW non-fossil capacity.

~172 GW

Solar module manufacturing capacity in India, as of 31 March 2026.

PIB, India’s Solar Growth Enters a New Era.

1 June 2026

Solar modules used in projects in India (including government schemes, net metering and open access) must use cells from ALMM List-II, the approved list for solar cells.

PIB, MNRE amendment to ALMM Order 2019; MNRE ALMM lists.

India: installed today against the 2030 goal

Sources: MNRE, Physical Achievements (30 Sep 2026); PIB (2030 target).

Quality rules are tightening too: crystalline-silicon PV modules sold in India must be registered with BIS under IS 14286, and the 2025 order sets minimum module efficiencies of 18% (mono-crystalline and thin-film) and 17% (poly-crystalline).

Sources: Bureau of Indian Standards, Scheme II registration; PIB, revised Quality Control Order for solar PV products.

The world

698 GW

PV installed worldwide in 2025: at least 608 GW reported plus about 90 GW from expert estimates.

IEA-PVPS, Snapshot of Global PV Markets 2026.

~3 TW

Cumulative PV capacity worldwide at the end of 2025.

IEA-PVPS, Snapshot of Global PV Markets 2026.

At this scale, a small difference in degradation rate is a large difference in energy, revenue and risk. Choosing the right bill of materials for the right climate matters more every year.

Story 4 of 4

What we are building

Āyuṣya connects the chain from cell to report. The screens below are roadmap designs from our prototype and use sample data. They show the design; they are not validated predictions.

  1. CellTechnology, passivation, metallisation
  2. Bill of materialsGlass, encapsulant, backsheet, frame, junction box
  3. ModuleStress tests, mechanisms, failure modes
  4. PlantClimate, yield, P50 and P90
  5. Scorecard and reportEvery number linked to its source
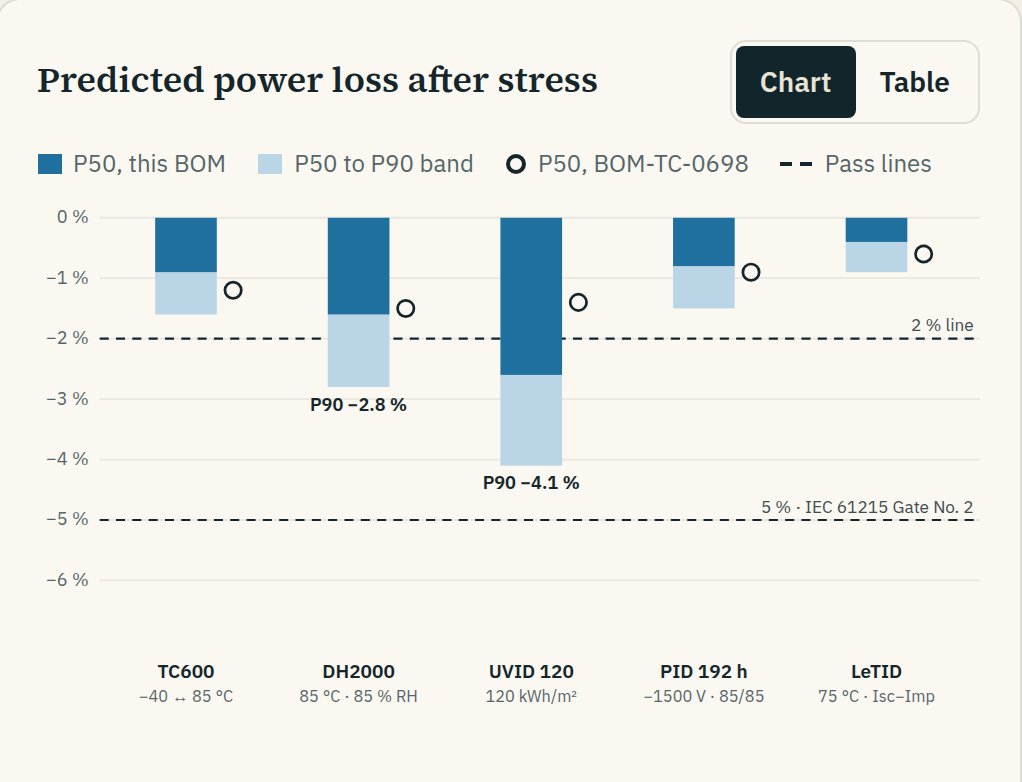
Predicted power loss after five stress tests for a sample module bill of materials, with P50 and P90 bars and 2% and 5% reference lines
SAMPLE DATA · ROADMAP DESIGNL2 BOM risk card: predicted power loss after stress. Tap to open full size.
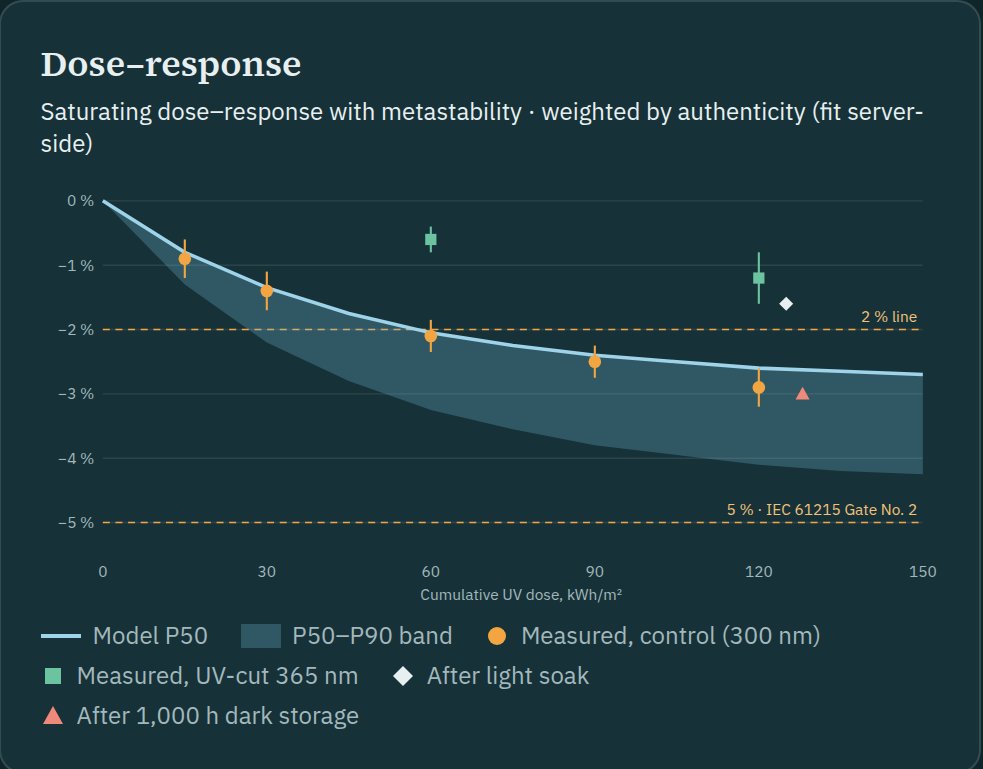
Dose-response chart for UV-induced degradation with a P50 curve, P50 to P90 band and sample measurements
SAMPLE DATA · ROADMAP DESIGNL3 failure-mode workspace: UV dose-response. Tap to open full size.